40 for 40: Who received the Impact for Growth grants?
Deborah Smart, Head of Programmes - Grants, Social Investment Business, shares key insights about the grant portfolio for the Growth strand of the Impact Management Programme.
After a very busy start to 2018, we have now made all the grant awards for the Impact for Growth strand of the Impact Management Programme.
Across the two phases of the programme, we have made 40 grants to 40 very different organisations. You can find more information about all of the organisations here, but I wanted to share some of the facts and figures about the makeup of the portfolio.
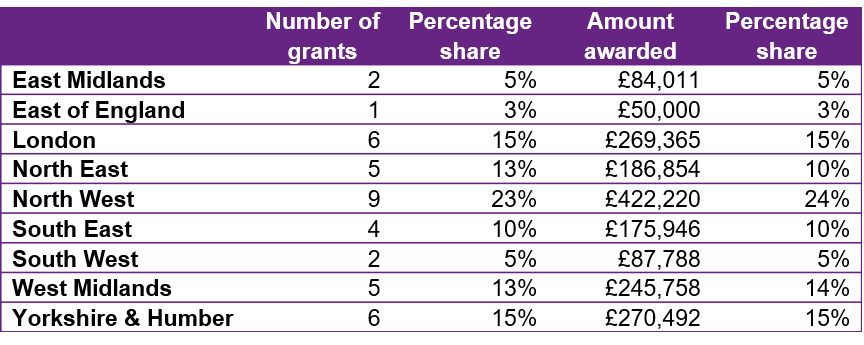
Where are they?
I’m really pleased that the grants were spread pretty evenly across the different regions. However, the figures do show us that the South West, East Midlands and East of England are comparatively underrepresented. We’ll certainly be thinking about this for future work to try and increase the number of applications from these regions - if you’ve got any suggestions please do get in touch.
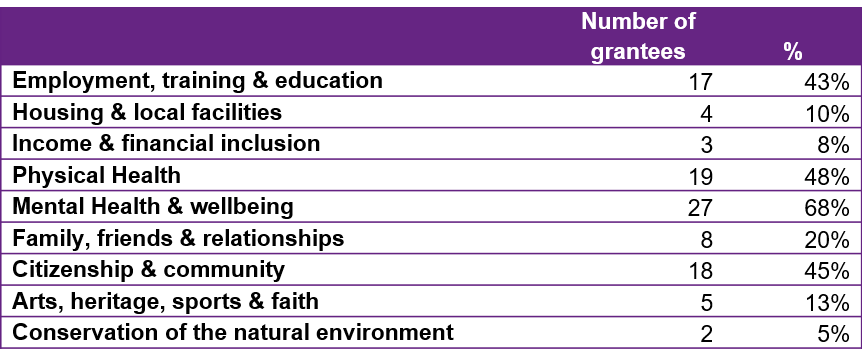
What sectors do they work in?
When we collect sector information, we record all the outcome areas that an organisation is working in. Most work in more than one area (hence why the percentage adds up to more than 100). We are thinking about changing the way we gather sector information to ask for a primary area, and then still for what other areas they also work in. We think this will give us a clearer picture of not only which sectors we are supporting, but which we need to work harder to reach.
As you can see from the table below, the organisations in the portfolio are also serving a wide range of sectors with mental health and wellbeing sitting as the most commonly worked in sector.
Where do they operate?
We ask organisations to tell us how far their work reached. Is it local? Regional? Do they work on a national level?
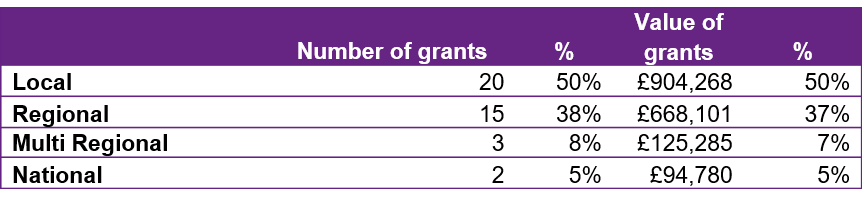 Most of the supported organisations are working in just their locality or within their region.
The size of organisations supported in terms of annual turnover is very broad, ranging from £105k to £25.7m! And the number of employees in these organisations is also very broad, ranging from 4 to nearly 600.
What all of this tells us is that there is no typical organisation that needs support when it comes to impact management. Organisations large and small are dealing with similar challenges and need support to improve. For the programme that is also very interesting as it gives us a range of different organisations that we will be able to learn from and share best practice.
What is the money being spent on?
Of the total grants awarded:
- 52% of the funding is being used to pay for Approved Provider costs (applicants need to work with an approved provider)
- 10% is paying for specialist provider costs (support from external organisations not on the approved provider list), and
- 38% is to pay for costs that the organisations that have received the grant will be incurring by undertaking the projects.
We are often asked about the costs of external support such as that delivered by Approved Providers. The average day rate for the work being done by Approved Providers for these grants is £630.
In terms of the type of work being done, we group this across five ‘building blocks’ of impact management. These five building blocks are crucial to effective impact management, and we let grantees decide which area they most needed to focus on and to breakdown their budget and project plan accordingly.
- Target population: the group(s) that your organisation wants to serve. Development in this area might include defining inclusion and exclusion criteria, understanding the characteristics and needs of existing beneficiaries or improving enrolment processes.
- Outcomes: the measures of success you seek to achieve for your target population. Development in this area might include analysing outcomes achieved for current beneficiaries, defining short-term, end-of-programme, and long-term outcomes, exploring validated outcomes scales, or training staff on outcomes scales.
- Programme design: the beneficiary journey through your programme/service. Development in this area might include analysing referral routes into the service, analysing successes and drop-outs, codifying programme operations or formalising enrolment and exit processes.
- Performance management: the use of data to take action and drive outcome improvements. Development in this area might include defining key questions and metrics to understand performance, reviewing current data systems and data review processes, or working on organisational culture and interest in data.
- Project learning: reflection and sharing of learning within your organisation and externally. This area might include capturing and communicating successes and challenges during the project and engaging a wider audience in the journey.

Next Steps
Now the interesting work really begins – we see how the funded projects evolve. Some of our pilot grants (awarded last Summer) are coming to an end, so we are starting to gather data about what these grants helped organisations to achieve. As we collate more of that data we will be sharing it as widely as possible. Because while we might only have awarded 40 grants, we want as many people as possible to benefit from the learning they gather.